A blueprint for measuring European cohesion
Learn about the methodological framework of the EU Cohesion Monitor and the quest for better pan-European data.
The EU Cohesion Monitor is a tool which allows users to swiftly browse a database that holds over 25,000 individual entries on the state of cohesion in Europe. Its goal is to give free and easy access to a time series that is growing annually and that tracks the willingness of European Union citizens and the readiness of their societies to cooperate and engage in joint efforts – a crucial precondition for Europe’s capacity to act in the world.
This article looks at the methodological framework on which the EU Cohesion Monitor is built. It highlights the most important steps on the journey from raw data to a single cohesion score for each EU member state. It further aims to make our model fully transparent and concludes with recommendations on how the EU Cohesion Monitor could be extended and upgraded in the future.
Cohesion vocabulary
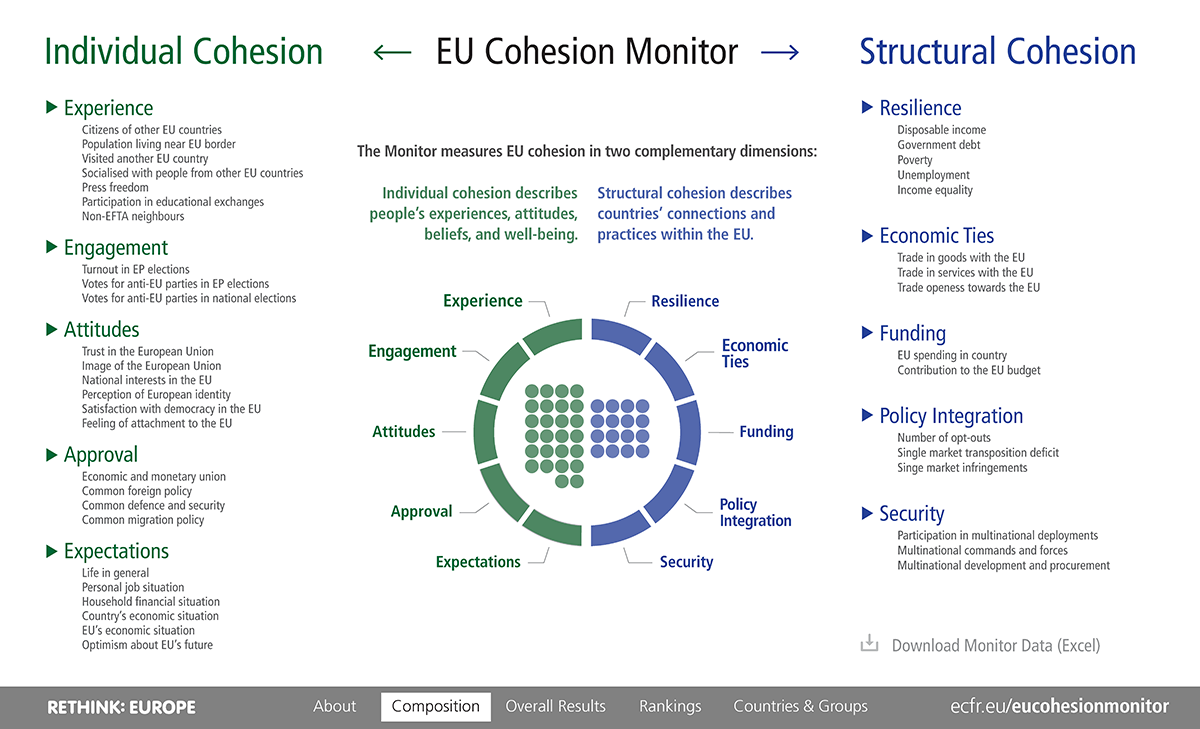
The EU Cohesion Monitor measures two dimensions of cohesion. ‘Individual cohesion’ quantifies citizen’s direct experiences, opinions, and expectations. ‘Structural cohesion’ measures cohesion at the macro level of policies, the state, and the economy. Each dimension comprises an equal number of building blocks called indicators. There are five on the individual side, and five on the structural side. Each indicator is further divided into factors.
The factor level is the lowest in the hierarchy of the model but the most specific. There are currently 42 factors in the model. Each captures a different aspect of cohesion. Factors are of different data types such as responses to Eurobarometer survey questions (in percent), a household’s disposable income (in euros), or troop deployments in military missions abroad (counted number). The 2019 EU Cohesion Monitor contains a dedicated chapter that gives a detailed overview of the monitor’s composition of dimensions, indicators, factors, and their sources:
The quest for better data
The selection of suitable factors as the building blocks of our model presents a dilemma identical for any attempt to approximate reality, in this case the past and current state of European cohesion. There is a variety of other variables that we would have liked to integrate in the monitor.
For example, how many EU citizens commute to a different EU member state every day and thereby have direct daily experiences with other Europeans? How many jobs are directly linked to participating fully in the single market? How could we measure the links and interdependencies between European businesses and production lines? How can we track European cohesion on the level of regions or even cities? How do we gauge the impact of citizens’ political engagement other than measuring election turnout? On the last question, see Timor Landherr’s and Oliver Unverdorben’s analysis that describes the tedious and often futile search for more relevant data.
Naturally, European cohesion is more than the statistics available to us. At the same time the EU Cohesion Monitor provides benchmarks for something that is by nature a moving target, much discussed but rarely defined or even quantified. This is the principal shortcoming that our framework addresses.
Does this scale?
To ensure comparability of the different data types at the factor level and prepare the aggregation to indicators and dimensions, each measure is converted to a scale of 1 to 10 points. On this scale 10 is the highest (best) score and 1 the lowest possible result. Exceptions to this rule apply for two of the five structural cohesion indicators: the scales for the Policy Integration and the Security indicators are limited to 7 points rather than 10 at the upper end. In these two cases the model deliberately leaves room for eventually extending the scale to the full 10 points should European integration progress further. For example, were the EU to adopt common climate, migration, or defence policies worth their names, the EU Cohesion Monitor would be adjusted to take this new quality into account. The current scaling rule means that even countries that fully participate in all policy fields covered by the Policy Integration indicator and those most active in security matters can at best score a maximum of 7 points.
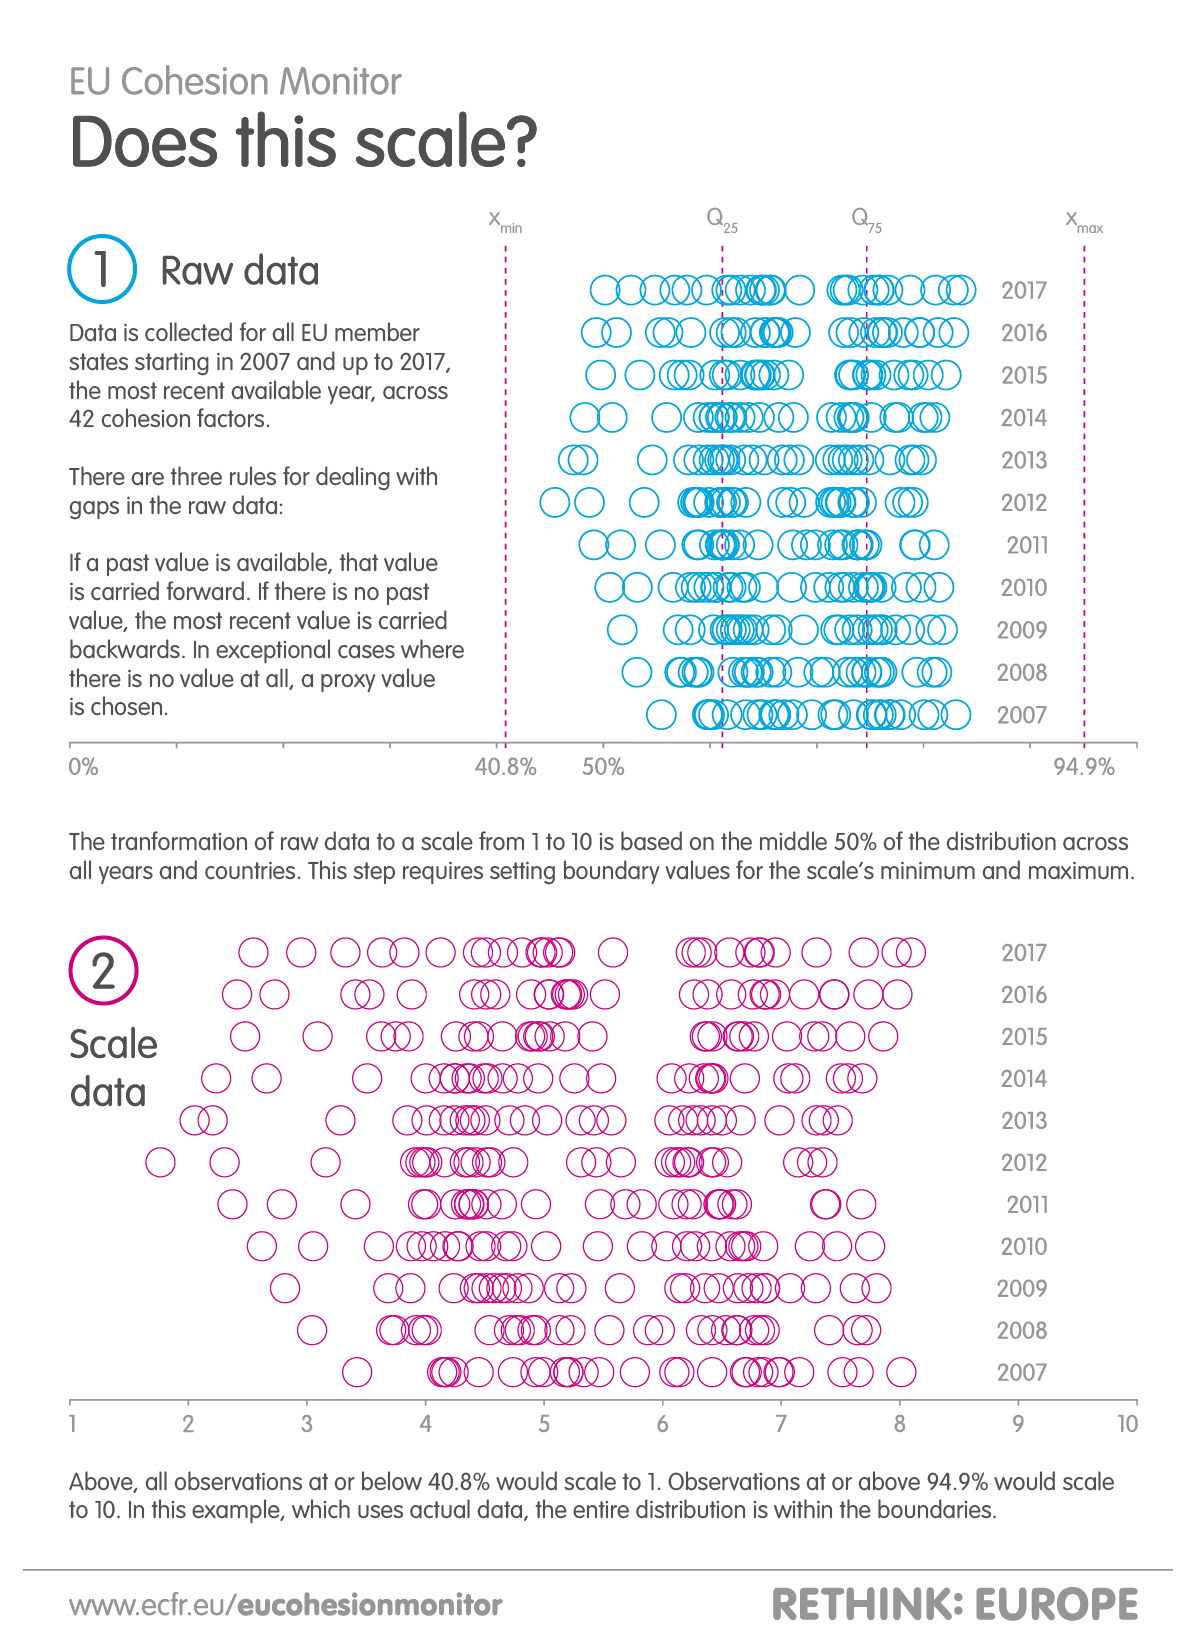
The conversion to scale is done in two different ways: linear transformation and counting. The former is the near universal type of conversion used in the monitor, as it is applied to 38 out of the 42 factors covered by the monitor. The remaining four do not need conversion as they are simply added or subtracted from the scales of their indicators. For example, in the Experience indicator, EU member states that share a land border with countries that are neither in the EU nor the European Free Trade Association (EFTA), are assigned an extra point that is added to the score of the other Experience factors. This is to account for the experience these societies have facing a significantly less open border than with their EU and EFTA neighbours.
As the above illustration shows, linear transformation preserves the relationships among the original data values and puts each one into perspective with all other observations of that factor across the entire group of 28 countries and all years in the timeline. This is achieved through either of the following two formulas. The first is used for all factors that describe something good for a country, the second is used for those factors which are ‘bad’ for a country. For example, very high income levels will yield a score close to or at the full 10 point mark (good). In contrast, a high unemployment rate is worth only few points . In the formula below, S signifies the scale’s range minus 1. For the scale from 1 to 10, S equals 9:
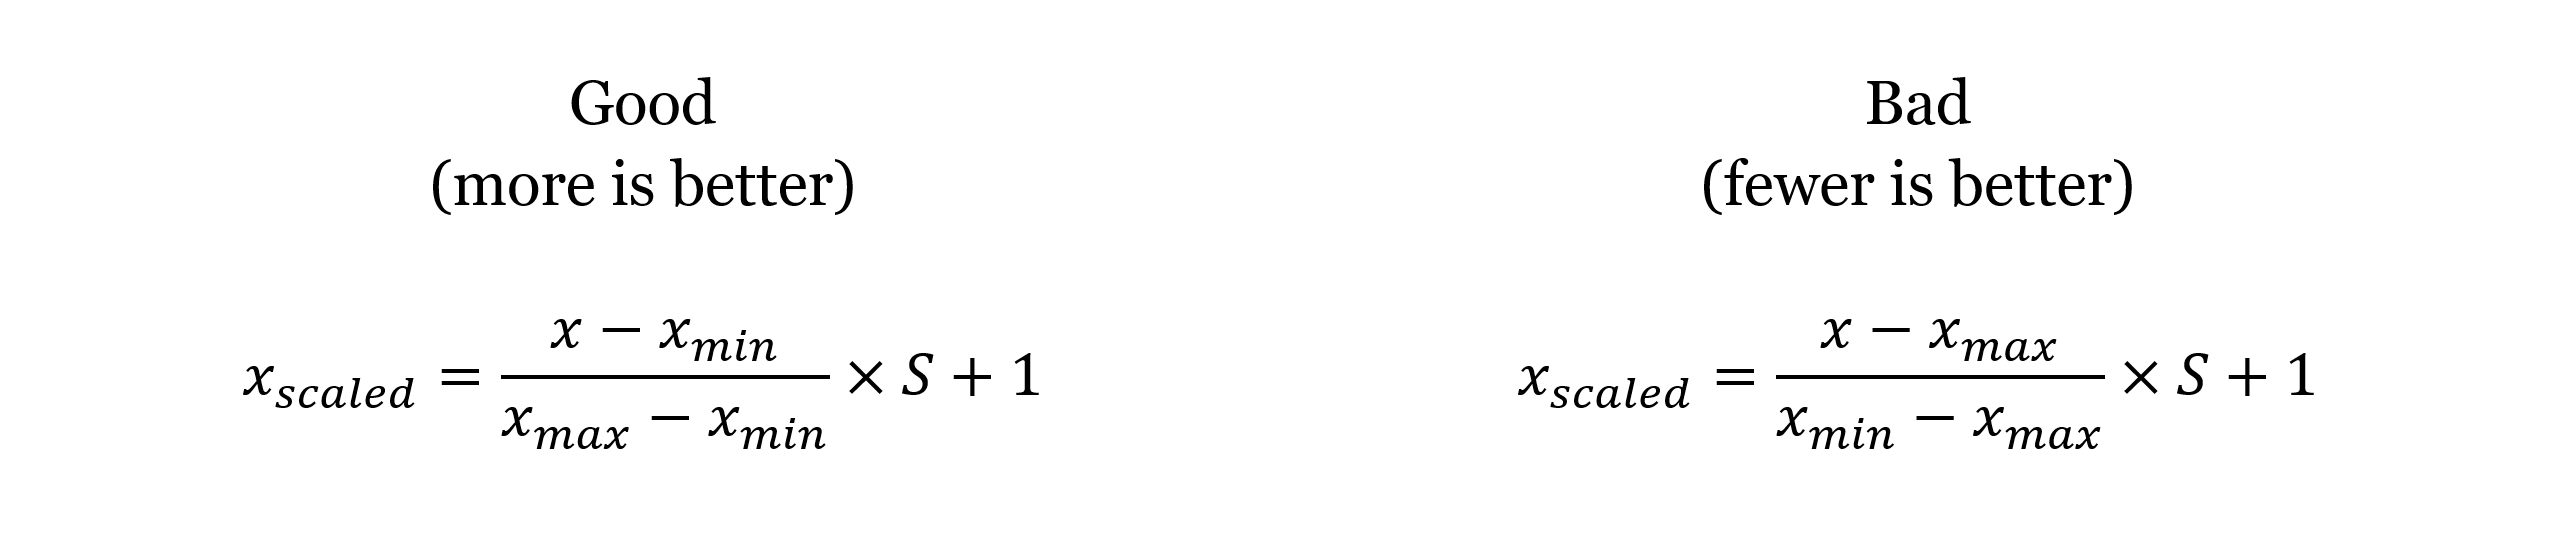
Converting to a common scale in this way requires setting boundary values for the scale’s lower and upper ends. These will yield 1 and 10 points respectively. The model does this by taking into account the quartiles of all observations. Specifically, it takes the range of the middle 50 percent of all observations and extends its lower and upper ends by a factor of 1.5 (extension of the interquartile range). The minimum and maximum for each scaling conversion is calculated as follows:

Exceptions to this global rule are only made for cases where we decided to set either more intuitive or more natural boundary values. For example, due to the range extension by 1.5 some observations could fall outside their natural boundaries, resulting, for example, in negative values for the minimum or values higher than 100 percent for the maximum. In these instances we set the minimum to 0 and the maximum to 100 percent or follow a qualitative judgement. For example, in the Engagement indicator, the upper boundary for the “Turnout in EP elections” factor is fixed to 70 percent rather than the formula-based result for of 90.43 percent. This corrects for compulsory voting in some member states that would otherwise skew the boundary upwards. Also, we consider an election turnout of 70 percent in any major election to be a strong enough result to merit 10 points, especially for European Parliament elections. In total we saw the need for five such qualitative corrections in the model, namely in the Engagement, Resilience, and Economic Ties indicators. The full details of all conversions and boundary calculations can be found in this data file, which is provided to make all our calculations transparent and reproducible.
Once all factors are converted, the results for indicators, dimensions, and overall cohesion are calculated by aggregation. In most cases an indicator is the simple average of its factors so that all factors are treated equally rather than being weighted. Three of the ten indicators require a slightly different logic: the Resilience indicator compares a ‘good’ factor with several ‘bad’ factors. In the Funding indicator the factor scores are added up. And in the Policy Integration indicator the factor counts are subtracted from the scale’s maximum of 7 points. Again, our data file allows the user to follow these steps in detail. Finally, the two dimensions of individual cohesion and structural cohesion are the average of their five respective indicators and overall cohesion scores are the average of both dimensions.
The way forward
Any future editions of the EU Cohesion Monitor should continually fine-tune the framework on which the Monitor is currently built. This could include adding new layers of information by, for example, providing detailed factor-level results and their correlations. The tool should also remain open to integrating new factors as soon as relevant data is available. In the often-proclaimed era of ubiquitous data, the current gap of two full calendar years with which the time series can be published reflects limited availability and currency of data suitable for international comparisons. In this regard, we would welcome efforts by the EU – and by extension institutions on the national level – to improve data access and quality. For example, data covering the Erasmus programme – one of the most tangible, longstanding, and successful EU initiatives – is still scattered across webpages, funding periods, and bulky report documents.
Going forward the monitor would further benefit from outgrowing its dependency on some data sources, notably survey data for which the Eurobarometer time series is sometimes patchy. Ideally this would include a dedicated European Cohesion Survey covering all EU member states with representative samples. This would allow the collection of information which is even more directly linked to the relevant indicators of the EU Cohesion Monitor. Coupled with a dynamic approach to visualising all data instantly, these measures would bring the monitor closer to the ideal of real-time cohesion tracking for the entire EU.
The EU Cohesion Monitor is part of ECFR’s Rethink: Europe data project, which is funded by Stiftung Mercator.
The European Council on Foreign Relations does not take collective positions. ECFR publications only represent the views of their individual authors.